An alert fired on a Saturday evening. By the time we saw the message, the agent had already diagnosed the root cause, proposed the fix, and was waiting for our approval to deploy. We had built the pipeline that did this. We just hadn't expected it to work that well, or that fast.
Then it fired 16 more times over the next 48 hours. The agent handled every single one.
How alerts reach the agent
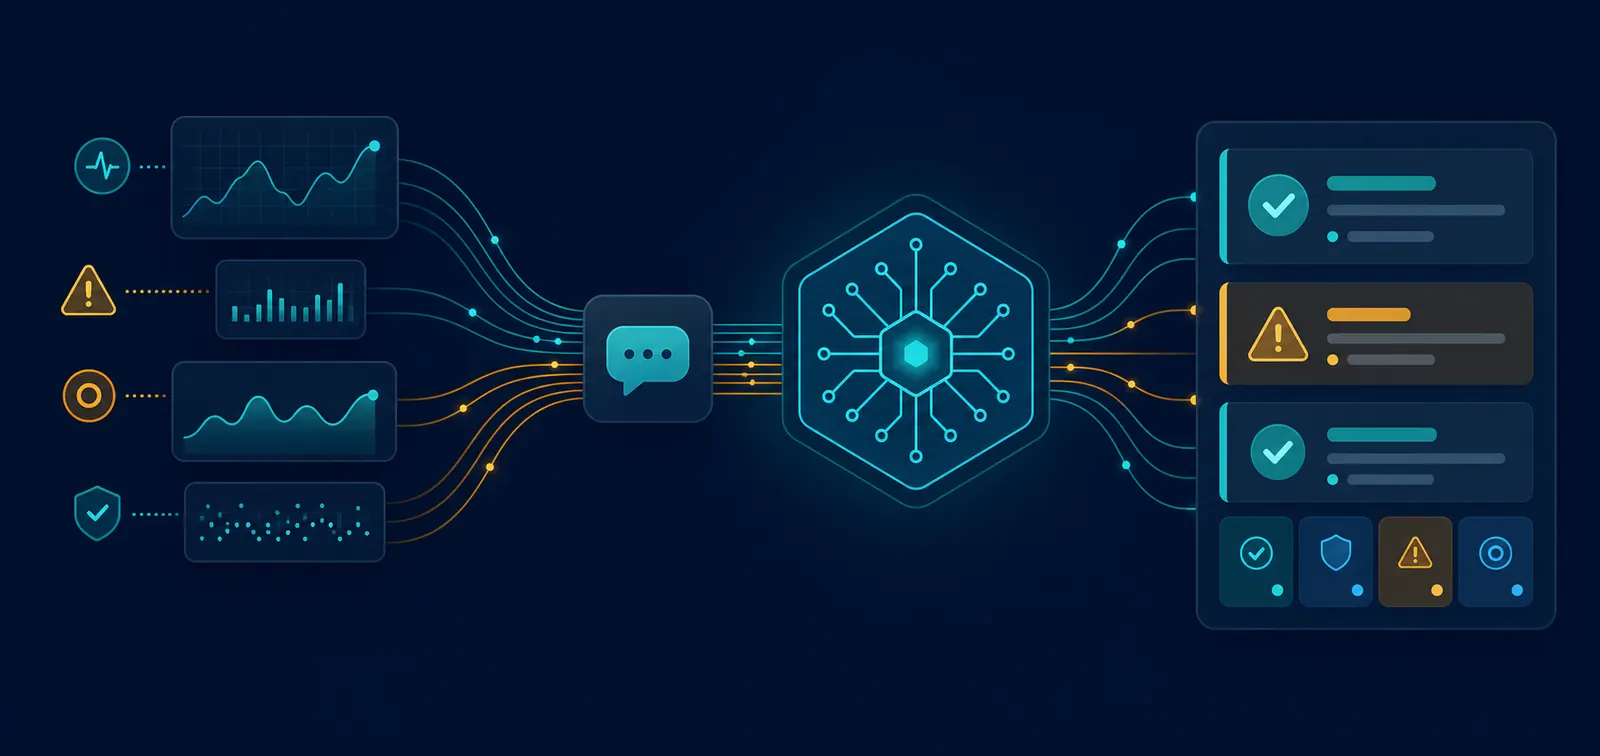
Alerts flow through three systems in a line:
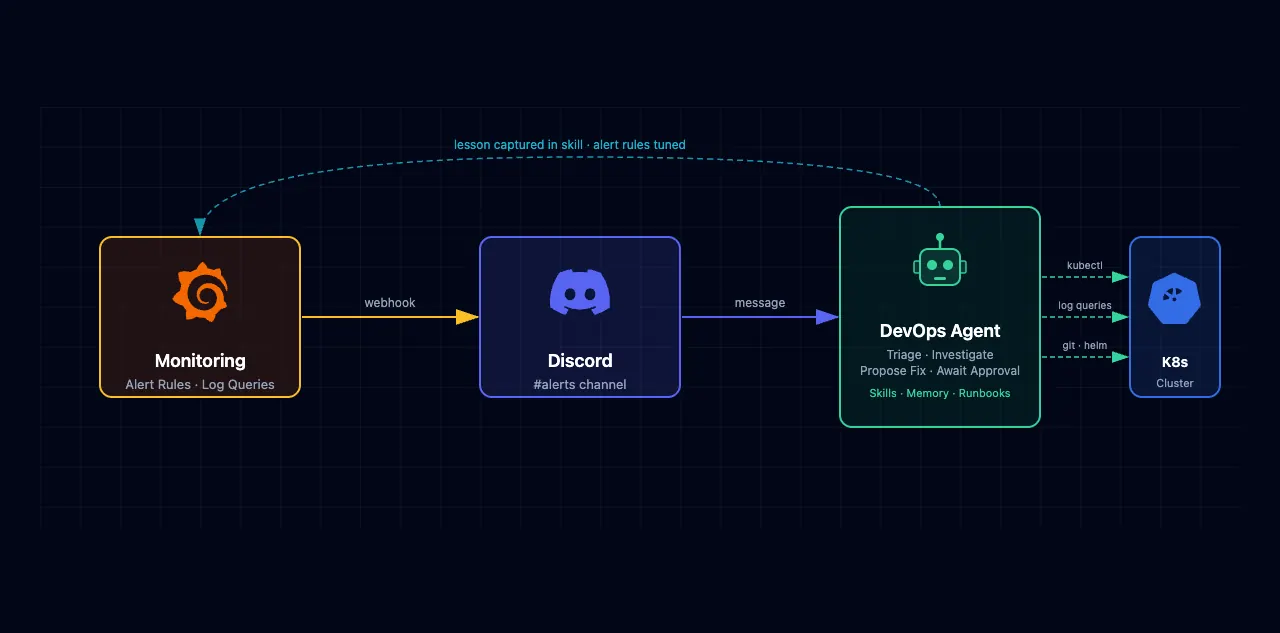
A monitoring stack collects logs and metrics. When alert rules evaluate those signals and hit their thresholds, they fire webhooks into a Discord channel. An AI agent watches that channel from a dedicated DevOps profile with its own tools, memory, and context. When an alert message lands, the agent picks it up and starts investigating within seconds.
The agent has real cluster access, the same access an on-call engineer would have:
| Tool | What it does |
|---|---|
| kubectl | Inspect pods, services, deployments, events |
| Log queries | Search and filter application logs |
| Port-forwarding | Reach internal dashboards temporarily |
| Helm | Check releases and chart state |
| Git | Fork, patch, commit, push |
It queries logs, traces root causes, and proposes fixes through the same deployment controls a human would use. Every change that carries risk requires our approval before it proceeds. The agent prepares the work, but a human gates the deployment.
The auth service incident
The first alert came from an authentication service throwing null pointer exceptions. The agent port-forwarded to the monitoring dashboard to check the alert state, then queried the service logs directly to find the stack traces.
The NPEs traced back to an event listener in an upstream dependency, where a cache key was being built by concatenating several nullable fields without checking them first. When any of those fields was null, the key computation blew up.
The upstream project was effectively unmaintained. The agent identified the root cause, forked it into our infrastructure repositories, added null checks with a fallback string for each field, built the artifact, and presented the full deployment plan for approval. We reviewed the diff, approved it, and the agent rolled it out through our existing deployment pipeline. From alert to proposed fix was under the time it took us to read the initial Discord notification.
The agent has cluster access to investigate, but every change that touches production requires our approval. That boundary was deliberate. The agent prepares the work and explains what it wants to do. A human decides whether it gets to do it.
Sixteen alerts, two real incidents
The remaining 16 alerts over the next two days were mostly mundane:
| Alert type | Source | Real incident? |
|---|---|---|
| Datasource errors | Log backend losing connectivity during spot instance churn | No |
| Lifecycle errors | Pods restarting during deployments | No |
| Stale alerts | Already resolved by the time the agent started | No |
| Application NPEs | Authentication service upstream bug | Yes |
| Service failures | NATS/JetStream connectivity loss | Yes |
For the noisy ones, the agent did exactly what we needed it to do. It read the alert, investigated, determined the service was healthy, and closed the investigation. A human was never going to look at those alerts. Without the agent, they would have sat in the channel, piling up, generating fatigue until someone muted the whole rule. The agent absorbed that load. It read every alert, decided whether it mattered, and only escalated the ones that did.
The real value surfaced when the agent started identifying patterns across the noise. After seeing the same datasource errors three times, it flagged them as recurring false positives and proposed specific changes to the alert rules. It turned noise into actionable signal that we could act on.
Three changes to our alert rules
The agent made our monitoring noise visible by cataloging every false positive it handled, and once we could see the pattern, we fixed the root causes. Three concrete changes over the course of 48 hours.
We split the generic error rule into two. One fires immediately on real application errors, the type where the first occurrence matters and you want to know right now. The other handles expected transient noise during pod lifecycle events, with a short buffer window so brief restarts do not page anyone.
The second fix targeted a broken query in one of our datasource health rules. The rule was supposed to evaluate whether the log backend was reachable, but the query was missing a reduce step:
Before: query A → threshold C    (operates on raw instant reads)
After:  query A → reduce B → threshold C  (aggregates over a window)
Without the reduce step, any single failed probe would trip the alert. Adding it fixed both the false positives and the evaluation status.
The third change was the error state handling on the generic detection rule. The rule had execErrState set to Error, meaning that if the query itself failed to execute (perhaps because the log backend was briefly unavailable), the rule treated that execution failure as a real detection and alerted on it. Changing execErrState to OK meant query failures simply skip evaluation.
If your alert rule treats a query execution failure as a positive detection, you will get false alerts every time your data source blips. This is one of the most common misconfigurations in rules that query log backends.
These were observability problems we had been sitting on for weeks. An agent investigating every single alert as if it were real forced us to confront how much noise our monitoring actually produced.
The learning loop
Once the agent had triaged a few alerts, we wanted it to get faster at recognizing ones it had seen before.
When every alert triggers a full investigation, response on real incidents can slow down. We needed the agent to recognize the difference between expected deployment churn and a genuine problem, without us intervening each time.
The mechanism was procedural knowledge embedded in skills. After each incident, we captured what happened: the alert, the root cause, what the agent did, what it should have done next time. Those lessons live in a skill that the agent loads on every session.
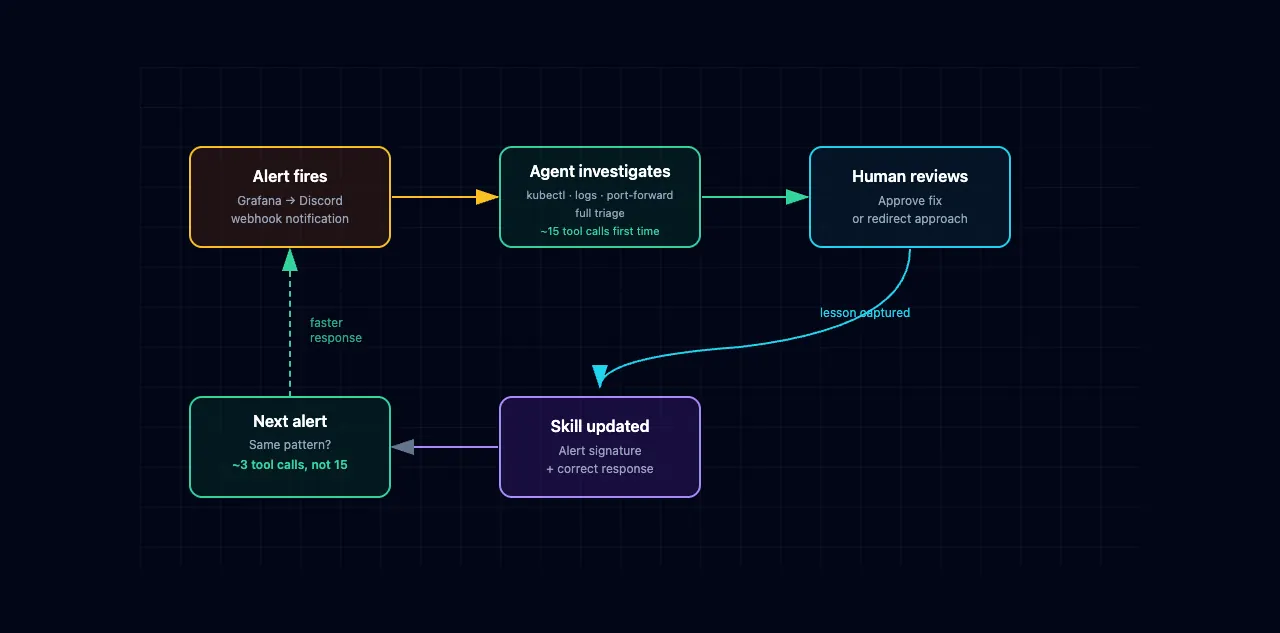
Spot node churn producing transient datasource errors was a recurring pattern. After the third occurrence, the agent stopped doing a full investigation and instead checked node health, confirmed the service recovered, and closed the alert in a few tool calls instead of fifteen. A language model reading a runbook and applying it achieves something close to what an experienced on-call engineer does: recognizing familiar situations and acting fast.
Approvals, redirects, and knowledge capture
The agent handles pattern recognition, log analysis, and executing well-defined remediation steps. Judgment calls that require context it does not have still land on us.
When the agent forked the upstream dependency and proposed the fix, that was the right call. We had set the boundary: the agent can prepare any change, but a human approves before it touches production. Business risk, regulatory concerns, customer communication: those stay with us.
We did notice the agent occasionally investigate with the wrong mental model. It would see an error, assume a root cause, and spend ten tool calls building a case for that hypothesis before checking whether a simpler explanation existed. A human engineer would have stepped back and asked "did anything deploy recently?" Stepping back requires prompting. The agent will chase a hypothesis as far as you let it.
The humans in this loop do three things now: approve changes that carry risk, redirect the agent when it chases the wrong hypothesis, and decide what knowledge to persist after each incident. Everything else, the agent handles.
What we would do next
Two improvements stand out if we were starting over. First, tune the alert rules before connecting the agent. The agent handled every alert we threw at it, including the noisy ones, but tuning the rules first means the agent only sees alerts worth investigating. That makes the pipeline cheaper and faster from day one.
Second, build the learning loop from the start. The first few incidents took longer because the agent had no context. Every investigation started from scratch. Once we started capturing lessons in skills, the agent recognized patterns and triaged in a fraction of the time. Setting that up earlier would have compounded the value sooner.
The pipeline runs now. Every incident makes the next response faster, and the agent continues to flag patterns we would have missed on our own.